Bitcoin: A Look Back, and a Look Ahead
Key Insights
In December 2020, Marion Street Capital (MSC) forecasted the price of Bitcoin by December 31st, 2021. Bitcoin finished 2021 at $46,306, above MSC’s probability-weighted estimate of $37,898 and between MSC’s base-case and best-case price targets of $32,734 and $75,374, respectively. Using the same approach, MSC projects a probability-weighted price for Bitcoin of $61,618 by 12/31/2022 with a range of $57,516 to $81,704, representing 33.1% upside relative to the price of Bitcoin on 12/31/2021 and 58.4% upside relative to the price on 2/1/2022.
Primary drivers of Bitcoin’s outperformance compared to estimates included MSC’s preference towards using all-time data instead of more narrow time frames and the outperformance of the S&P500 (“GSPC”). Interestingly, MSC discovered that Bitcoin price is most sensitive to the GSPC and that it has a negative correlation with the price of gold.
Bitcoin acceptance among financial institutions and the retail market continued its positive momentum in 2021, highlighted by the record 153% increase in Bitcoin ATMs and the first Bitcoin ETF, which attracted $1.2B is assets since launch.
In 2022, key Bitcoin trends may include more regulatory attention, more Bitcoin ETF launches, more Bitcoin ATM installations and transactions, environmental improvements, and more price volatility.[1] Although the MSC predictive model with the most explanatory power projects a Bitcoin price roughly 58% greater than recent pricing, the MSC forecast yields a forecast range between $57,516 and $81,704, and alternative pricing methodologies MSC analyzed yield prices between $15,407 and $49,153.
Overview
Researchers still find themselves debating what methods they deploy to forecast the price of Bitcoin and other cryptocurrencies. While the key to this problem may be to hypothesize, test, and revise over time, MSC in December 2020 investigated what factors influenced the price of Bitcoin, then used those findings to forecast a price for the asset. How did the forecast perform in 2021, and what did we learn?
Our Process
MSC built a one-year forecast for the price of Bitcoin using the following methodology.
First, MSC identified seven key variables that may influence the price of Bitcoin:
Bitcoin Supply
Bitcoin Transaction Volume
The Price of Gold
The Price of the S&P 500 (“GSPC”)
Unique Blockchain Users
Bitcoin Google Searches
Bitcoin ATMs
MSC gathered this data from a variety of sources starting either in January of 2009 or whenever variable-specific data was available. MSC tested the significance of the variables for inclusion in the resulting model.
MSC then least-squares regressed the price of Bitcoin over the entire time period, over the past five years, and over the past year on these variables. Within each time frame, MSC analyzed three different potential models, incorporating different permutations of variables to achieve a final population model with most explanatory power. These three models were:
Model 1: Bitcoin regressed on ATMs
Model 2: Bitcoin regressed on all variables
Model 3: Bitcoin regressed on ATMs, Volume, Supply, GSPC, Gold
Model 2 ultimately demonstrated the most explanatory power compared to Model 1 and Model 3. After selecting Model 2 as the optimal model, MSC created a matrix to summarize the worst-case, base-case, and best-case assumptions for the values of each independent variable by 12/31/2021, and we assigned probabilities to each scenario based on MSC’s outlook for that variable. Overall, MSC assigned a 19% probability to the worst-case, 55% to the base-case, and 26% to the best-case. To arrive at these estimates, MSC projected worst-case, base-case, and best-case probabilities for each variable in the model and took the average.
The nine scenarios for each model (three time periods multiplied by three different cases) yielded the following forecast for the price of Bitcoin on December 31st, 2021:

The output for Model 2, the most powerful model, yielded upside between 26% and 89% for 2021. MSC determined the final output by assigning weights of 65%, 25% and 10% to the All-Time, 5Y, and 1Y time frame price targets respectively. Using these assumptions, MSC’s model yielded a probability-weighted price target for Bitcoin at year-end 2021 of $37,898, representing a 43% upside compared to the price of $26,443 on 12/27/20.
Outcome
Bitcoin ended 2021 at $46,306, up 75.1% since 12/27/20. This fell between MSC’s weighted base-case and best-case projections for Model 2 and was 22.1% higher than the probability-weighted estimate of $37,898 MSC forecasted in December 2020. Performance for each of the variables MSC included in Model 2 is in the table below:
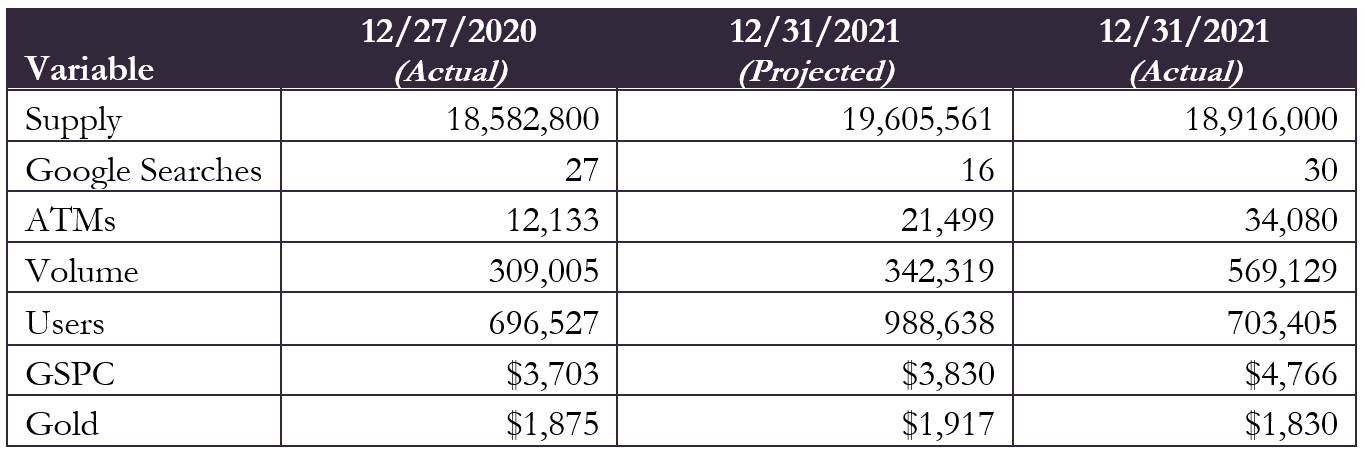
Google Searches, ATMs, Volume, and GSPC outperformed MSC’s forecast, while Supply, Users, and Gold underperformed forecasts. The most notable variable to outperform MSC’s projections was GSPC (the S&P 500), at 24.4% above the forecast. Since GSPC had the largest coefficient of 6.47 in the optimal model, we can conclude that it was the primary driver of the price for Bitcoin finishing above MSC projections.[2]
MSC would also strongly consider weighing recent data higher compared to longer-term data. In the 2021 projection, MSC assigned weights of 65%, 25% and 10% to the All-Time, 5Y, and 1Y time frame price targets respectively. MSC should have assigned a higher weight to the 1Y time frame and a lower weight to the All-Time time frame. The narrative with Bitcoin shifted over time, and MSC should have weighed recent sentiment higher than sentiment in 2009-2013, for example.
This would have produced a much more accurate result. If MSC reversed the weights assigned to the All-Time period and 1Y period, the probability-weighted output would have been $46,802, just 1.1% off the price on 12/31/2021.
Using the same methodology and variable weighting above but with an updated dataset, MSC’s model implies a probability-weighted price for Bitcoin for 12/31/2022 of $61,618, representing approximately 33% upside relative to the price on 12/31/2021, and approximately 58% upside relative to the price as of 2/1/2022. MSC made the following adjustments to the model weights to arrive at this estimate:
Adjusted weights of the All-Time, 5Y, and 1Y time frames to 10%, 20%, and 70% respectively, as MSC wanted to reduce its reliance on less relevant data.
Adjusted weights of Models 1, 2, and 3 to 0%, 30% and 70% respectively, due to changes in the explanatory power of each model compared to last year.
A Look Back [3],[4],[5],[6]
Take note of these six key Bitcoin-related milestones in 2021.
$1T Valuation: On February 19, 2021, Bitcoin surpassed the $1T value mark.
Increased Participation: In 2020, 11% of American’s owned Bitcoin according to Forbes. Now, a survey from Pew Research indicates this reached 16%.
Legal Tender: El Salvador passed a new law in June, approving Bitcoin as legal tender in the country. The country also announced floating a $1B “Bitcoin Bond” with legislators considering setting the legal groundwork for issuing these bonds.
Bitcoin ETF: In October, ProShares launched the first ETF based on Bitcoin futures. It traded nearly $1B on the first day of trading, and it attracted $1.2B in assets.[7]
ATM Explosion: The number of Bitcoin and cryptocurrency ATMs increased by a record 153% in 2021, and are now being installed in national retailers such as Walmart and Circle-K.
Other key developments in 2021 included PayPal launching crypto functionality, Tesla accepting Bitcoin as a form of payment (before later discontinuing it), and China exercising its right to ban trading in the country.
A Look Ahead [8],[9]
Be on the lookout for these four trends in 2022.
Regulatory Attention: Last month, six chief executives from cryptocurrency companies testified in front of Congress, as Bitcoin and similar tokens became more mainstream than ever before. Experts expect hearings and attempts at regulation to continue as popularity continues to grow.
Environmental Improvements: Skeptics and conservationists cast a light on the crypto mining industry for the adverse effects it has on the environment. Smaller tokens, and now Ethereum shifted to a proof-of-stake method, which does not require the level of energy use as it once did. Other coins may adopt a similar practice, although MSC feels this is less likely with Bitcoin.
More ETFs: As institutional and retail investors put faith in crypto and Bitcoin ETFs, the SEC is likely to reduce the barriers to entry for similar products.
Increased Adoption as Legal Tender: Lost confidence in central banks or authoritarian governments. Countries and regions need sound money to stabilize their economies and attract capital.
Alternative Pricing Methodologies
In addition to the method MSC outlined above, there are three additional angles which may provide insight into pricing Bitcoin:

The Sharpe Ratio Relative to GSPC: The historical annualized Sharpe Ratio for the GSPC since 1/1/2012 is 0.49. Assuming the Sharpe Ratio for the GSPC and Bitcoin are similar, this approach implies a price for Bitcoin by 12/31/2022 of $49,153. The monthly volatility of Bitcoin total returns from 1/2012 through 12/2021 is 43.4%, multiples higher compared to the monthly volatility of GSPC at 4.1% over the same time span.
The Pyramid Approach: ARK Invest, a fund focused on innovation, including Bitcoin and other cryptocurrency, released a white paper outlining their thoughts on valuing Bitcoin in January 2022. Yassine Elmandjra, the author, approaches Bitcoin valuation as three levels of a pyramid, with a more concentrated target audience as one ascends the pyramid. The bottom level addresses overall network health, including two metrics MSC used: transaction volume and number of unique users. He also includes some metrics which MSC did not, such as hash rate and monetary policy.
Possibly the most interesting approach Elmandjra took in the second layer, Buyer and Seller Behavior, was to analyze Bitcoin HODL Waves, a metric Dhruv Bansal conceptualized in 2018. This metric analyzes the quantity of Bitcoin the market traded by holding period (e.g. under 2 weeks, 2-4 weeks, etc.), and data shows that the longer-term HODL Waves grow as downturns come along.
The final layer, which MSC considers to be the most relevant approach, is targeted at active managers, and values Bitcoin relative to other metrics, like the relative valuation approach for public equities. These are the most digestible and offer potential insight into medium-term price inefficiencies.
About Marion Street Capital
Marion Street Capital (MSC) is a business growth consultancy helping innovative growth companies solve their most pressing challenges.
We collaborate with ambitious leaders to provide time-saving partnership, unparalleled support, and world-class expertise designed to ensure lasting business success — at scale. We work with clients to achieve growth of 10x or more by delivering world-class services in five key areas: FinOps, DataOps, RevOps, HROps, and SpecialOps.
MSC’s resources include relationships with institutional investors (family office, private equity firms, venture capital firms, hedge funds, and mutual funds), relationships with local and international banks, “expert networks,” relationships with top academic institutions, outsourced software development teams, graphic design services,
and industry information providers. This robust suite of services enabled MSC to help clients across 16 different industries during the last two years
Footnotes
[2] Coefficient in the All-Time regression under Model 2, the time frame MSC assigned the highest weight to within Model 2. MSC also standardized the price of GSPC using log.
[3] FinTech Magazine - Top Crypto Developments
[4] Pew Research - Bitcoin Ownership.
[5] CNBC - Key Moments in Crypto
[7] https://www.marketwatch.com/investing/fund/bito
[8] Decrypt - 2022 Bitcoin Trends
[10] Price per kWh x 142,498 kWh required to produce 1 Bitcoin
[11] https://www.statista.com/statistics/1200477/bitcoin-mining-by-country/
[12] https://minerdaily.com/2021/how-much-power-does-it-take-to-mine-a-bitcoin/
Disclaimer
The information provided herein was prepared by non-research personnel, and it is not a product of any Equity Research or Fixed Income Research Departments. Unless indicated, all views expressed herein are the views of the author and may differ from or conflict with those of others employed by any Securities Firm.
This material is not (and should not be construed to be) investment advice (as defined under ERISA or similar concepts under applicable law). The information provided herein has been prepared solely for informational purposes and is not an offer to buy or sell or a solicitation of an offer to buy or sell the securities or instruments mentioned or to participate in any trading strategy. These materials have been based upon information generally available to the public from sources believed to be reliable. No representation is given with respect to their accuracy or completeness, and they may change without notice. Marion Street Capital, its principals and employees, disclaim any and all liability relating to these materials, including, without limitation, any express or implied representations or warranties for statements or errors contained in, or omissions from, these materials.
Unless stated otherwise, the material contained herein has not been based on a consideration of any individual client circumstances and as such should not be a personal recommendation. We remind investors that these investments are subject to market risk and will fluctuate in value. The investments discussed in this communication may be unsuitable for investors depending upon their specific investment objectives and financial position. Where an investment is denominated in a currency other than the investor's currency, changes in rates of exchange may have an adverse effect on the value, price of, or income derived from the investment. The performance data quoted represents past performance. Past performance is not indicative of future returns.
No representation or warranty is made that any returns indicated will be achieved. Certain assumptions may have been made in this analysis which have resulted in any returns detailed herein. Transaction costs (such as commissions) are not included in the calculation of returns. Changes to the assumptions may have a material impact on any returns detailed. Potential investors should be aware that certain legal, accounting and tax restrictions, margin requirements, commissions and other transaction costs and changes to the assumptions set forth herein may significantly affect the economic consequences of the transactions discussed herein. The information and analyses contained herein are not intended as tax, legal or investment advice and may not be suitable for your specific circumstances. By submitting this communication to you, Marion Street Capital is not advising you to take any particular action based on the information, opinions or views contained herein, and acceptance of such document will be deemed by your acceptance of these conclusions. You should consult with your own municipal, financial, accounting, and legal advisors regarding the information, opinions or views contained in this communication.
These materials may not be distributed in any jurisdiction where it is unlawful to do so. The products described in this communication may not be marketed or sold or be available for offer or sale in several jurisdictions where it is unlawful to do so. Third-party data providers make no warranties or representations of any kind relating to the accuracy, completeness, or timeliness of the data they provide and shall not have liability for any damages of any kind relating to such data.
The trademarks and service marks contained herein are the property of their respective owners. Additional information on securities discussed herein is available on request. This communication or any portion hereof, may not be reprinted, resold, or redistributed without the prior written consent of Marion Street Capital.